


Bitcoin’s current price structure is prompting a reassessment in how this cycle is being interpreted. The only place to look for clues is the past, and an interesting technical analysis shows that Bitcoin’s current pattern resembles the slower, methodical buildup that defined 2017.
A long-term chart built around a linear regression channel shows that Bitcoin may still be in a preparatory phase, with one major technical barrier separating today’s consolidation from what could become a powerful rally.

The Linear Regression Line Holding Back The Breakout
Technical analysis of Bitcoin’s price action posted on X by crypto analyst CW looks at the leading cryptocurrency’s price action fitted on a linear regression, with clearly defined support and resistance bands stretching back over a decade. Notably, Bitcoin’s most aggressive bull phases depicted on the chart began only after price broke above the regression trendline convincingly.
In the 2017 cycle, Bitcoin spent a prolonged period consolidating below this line before finally pushing through it. Once that breakout occurred, the price entered into a strong rally phase that lasted one year. The move ultimately carried BTC from below $1,000 to almost $20,000 in a relatively compressed timeframe.
On the other hand, the 2021 cycle showed a different behavior. Bitcoin’s price action moved more faster earlier in the structure, breaking above trend resistance sooner and running into its $69,000 peak without the same extended base formation seen in 2017.
The current cycle, according to the chart, has yet to produce a decisive break above the linear regression fit. Although Bitcoin has already created a new all-time high above $126,000 on its normal price chart, the price is still respecting this long-term trendline as a ceiling, and this is a sign that the major expansion phase is yet to come. Therefore, the outlook is that the real rally will begin only after this barrier is cleared with conviction.
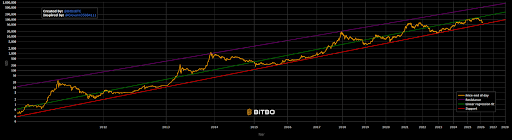
BTC Price Chart. Source: @CW8900 On X
Structure Points To A Breakout Setup To $500,000
Going by this linear regression fit, Bitcoin is still in an accumulation phase. That assertion is due to the prolonged consolidation below the green regression trendline in the chart above. Right now, BTC is approaching the red support trendline, and the next outlook is a bounce from the support.
The red support trendline on the chart has repeatedly acted as a floor during pullbacks across several cycles. Whenever Bitcoin has tested or moved close to this area, it has coincided with periods that later proved to be significant accumulation phases.
If history repeats in a 2017-style fashion, the important rally moment would be a breakout above the green linear regression fit trendline, followed by a push to the purple resistance trendline. According to the projection illustrated on the chart, such a move would place Bitcoin in a trajectory that targets the $500,000 range before meeting that resistance trendline.
Featured image created with Dall.E, chart from Tradingview.com

Editorial Process for bitcoinist is centered on delivering thoroughly researched, accurate, and unbiased content. We uphold strict sourcing standards, and each page undergoes diligent review by our team of top technology experts and seasoned editors. This process ensures the integrity, relevance, and value of our content for our readers.