


XRP price is forming a potential Gartley harmonic pattern near $1.30 support, signaling a possible bullish bottom as price rotates within a broader range.
Summary
- XRP developing Gartley harmonic pattern near $1.30 support
- Holding above $1.20 keeps bullish reversal structure valid
- Completion of leg D could trigger a strong upside rally
XRP (XRP) price action is beginning to show technical structure as a potential Gartley harmonic pattern develops near the $1.30 region. After weeks of rotational trading between high-timeframe resistance near $1.80 and strong support around $1.20, the market now appears to be transitioning into a pattern-driven consolidation phase that could precede a larger directional move.

Harmonic patterns, particularly the Gartley structure, rely heavily on Fibonacci relationships and precise price pivots. Recent XRP movements align closely with these technical requirements, with price rejecting key Fibonacci levels and forming recognizable swing structures. This evolving setup raises the question whether XRP is establishing a bullish bottom within its current range.
While confirmation is still required, the ongoing formation suggests a growing upside potential if support continues to hold.
XRP price key technical points
- Gartley pattern forming near $1.30: Fibonacci reactions are shaping harmonic structure development
- Range environment intact: XRP continues rotating between $1.80 resistance and $1.20 support
- Potential 60% upside projection: Completion of leg D could trigger a strong bullish rally
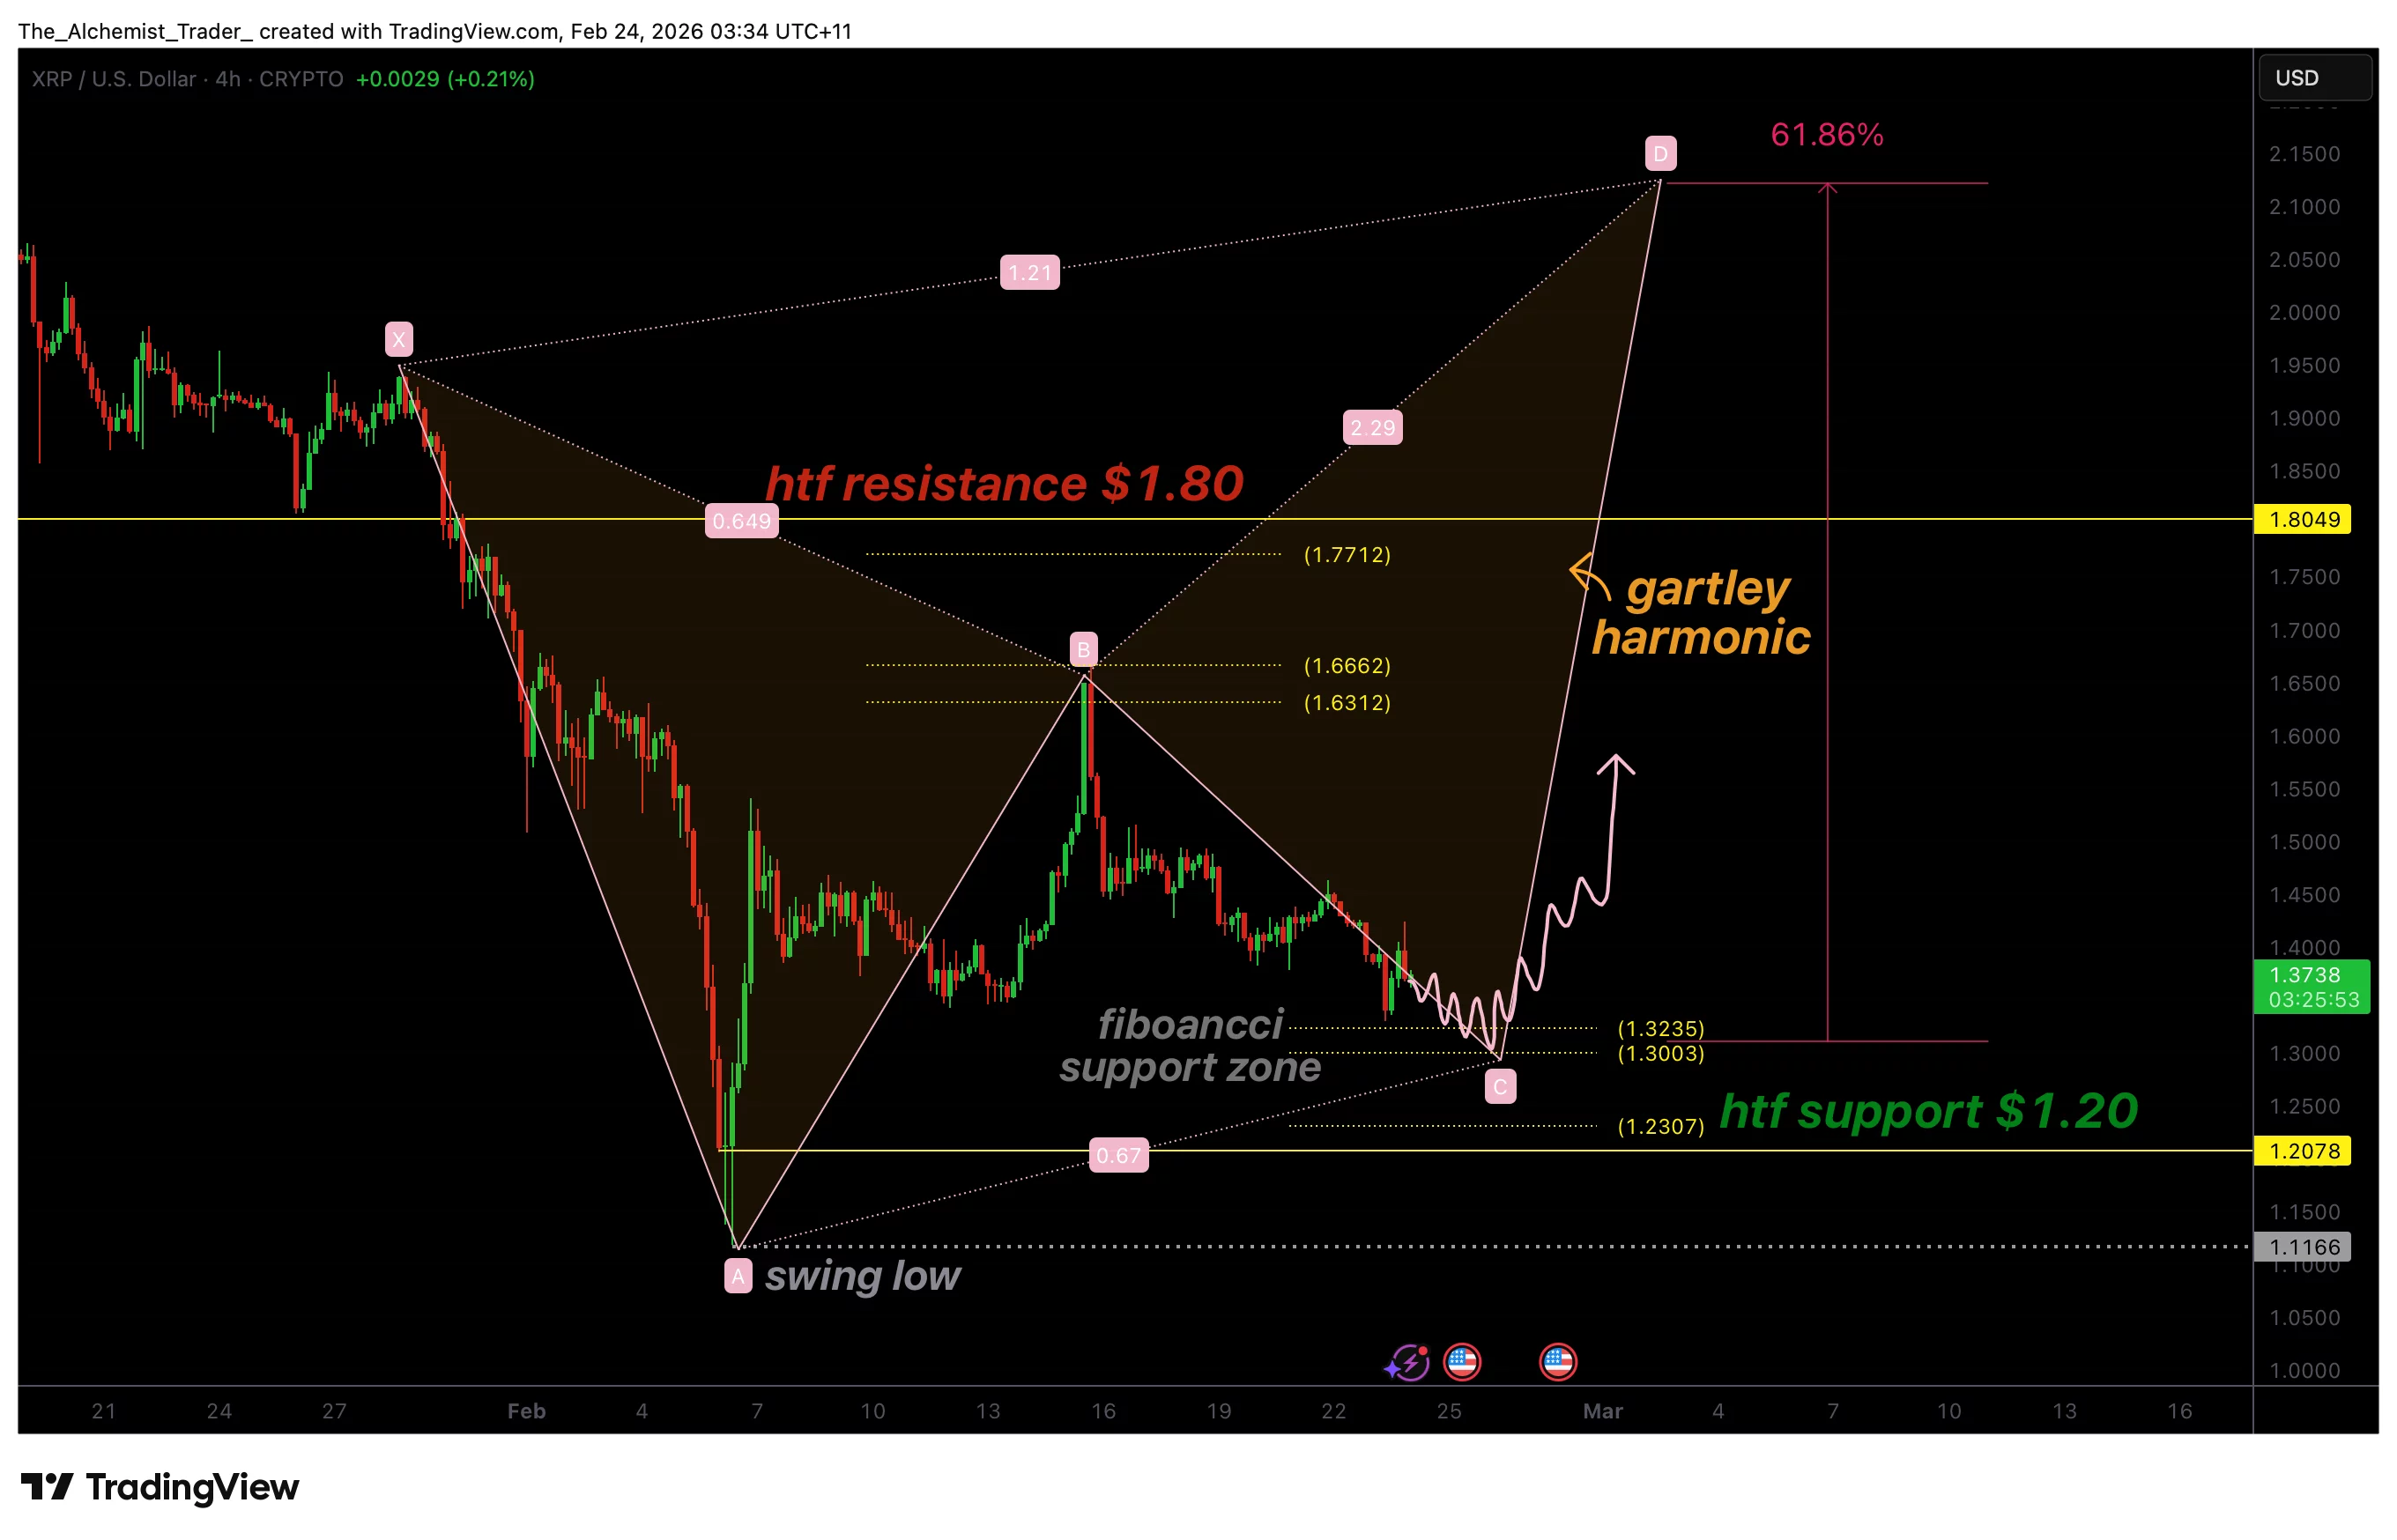
XRP has spent recent months trading within a well-defined range, oscillating between high-timeframe resistance at $1.80 and major structural support at $1.20. Rather than trending impulsively, price has displayed rotational behavior, a condition that often allows harmonic patterns to develop naturally.
The latest corrective move saw XRP reject the 0.618 Fibonacci retracement, an important technical reaction that supports the formation of a Gartley pattern. Price is currently trading below a local Fibonacci support zone, aligning with expectations for the ongoing development of the pattern’s internal legs.
In harmonic analysis, a Gartley pattern typically unfolds through multiple measured swings labeled X, A, B, C, and D. XRP appears to be progressing through the latter stages of this structure, with several clean pivots already established. These pivots reflect strong technical reactions at Fibonacci levels, reinforcing the validity of the developing setup.
Support defense critical for pattern validation
For the Gartley pattern to remain valid, XRP must continue to hold above the high-timeframe support near $1.20. This level represents a critical point of invalidation. Acceptance below it would weaken the harmonic structure and increase the probability of a deeper corrective move.
However, as long as price maintains support and reacts positively near the 0.618 Fibonacci region, the pattern continues to mature. The immediate focus shifts toward the completion of leg C, which typically precedes the impulsive move toward leg D, the final stage of the harmonic formation.
The significance of this stage lies in market psychology. Harmonic patterns often develop during periods of uncertainty, where both buyers and sellers test liquidity extremes before a clearer directional bias emerges. XRP’s repeated reactions at key Fibonacci zones suggest that market participants are actively responding to these technical levels.
Upside potential builds toward leg d completion
If XRP successfully completes leg C and establishes support in the current technical region, the probability increases for a bullish expansion toward the projected completion of leg D. Based on harmonic measurements, this move could represent a rally of approximately 60% from current price levels.
The projected upside aligns with higher resistance areas within the broader range structure, potentially revisiting zones closer to $1.80 and beyond. Importantly, this scenario does not require an immediate breakout but instead reflects a structured recovery within the existing market framework
Momentum confirmation will likely come through sustained higher lows, improved trading volume, and continued respect of Fibonacci retracement levels. These factors would signal that buyers are gaining confidence and positioning ahead of a larger move.
What to Expect in the Coming Price Action
From a technical, price-action, and market-structure perspective, XRP’s developing Gartley pattern suggests a bullish bottom may be forming near $1.30. As long as price remains above the $1.20 high-timeframe support and holds the 0.618 Fibonacci region, the probability favors completion of leg C followed by a rally toward leg D.