
Bitcoin price impulsive rally is approaching a dense resistance cluster, raising concerns that the move could evolve into a bull trap.
Summary
- Price testing channel high and Fibonacci resistance
- Declining volume signals weakening bullish momentum
- Rejection risks rotation toward $60,000 channel support
Bitcoin (BTC) price has staged a sharp recovery from recent lows near $60,000, pushing price back toward the upper boundary of its broader trading channel. While the rally has improved short-term sentiment, the technical landscape suggests caution.

Multiple layers of resistance now converge above price, creating conditions where upside continuation may struggle to sustain momentum.
Bitcoin price key technical points
- Channel Resistance: Price approaching upper boundary of established trading channel.
- Fibonacci Confluence: Overhead resistance aligns with key swing high and moving averages.
- Volume Concern: Declining participation signals potential bull trap formation.
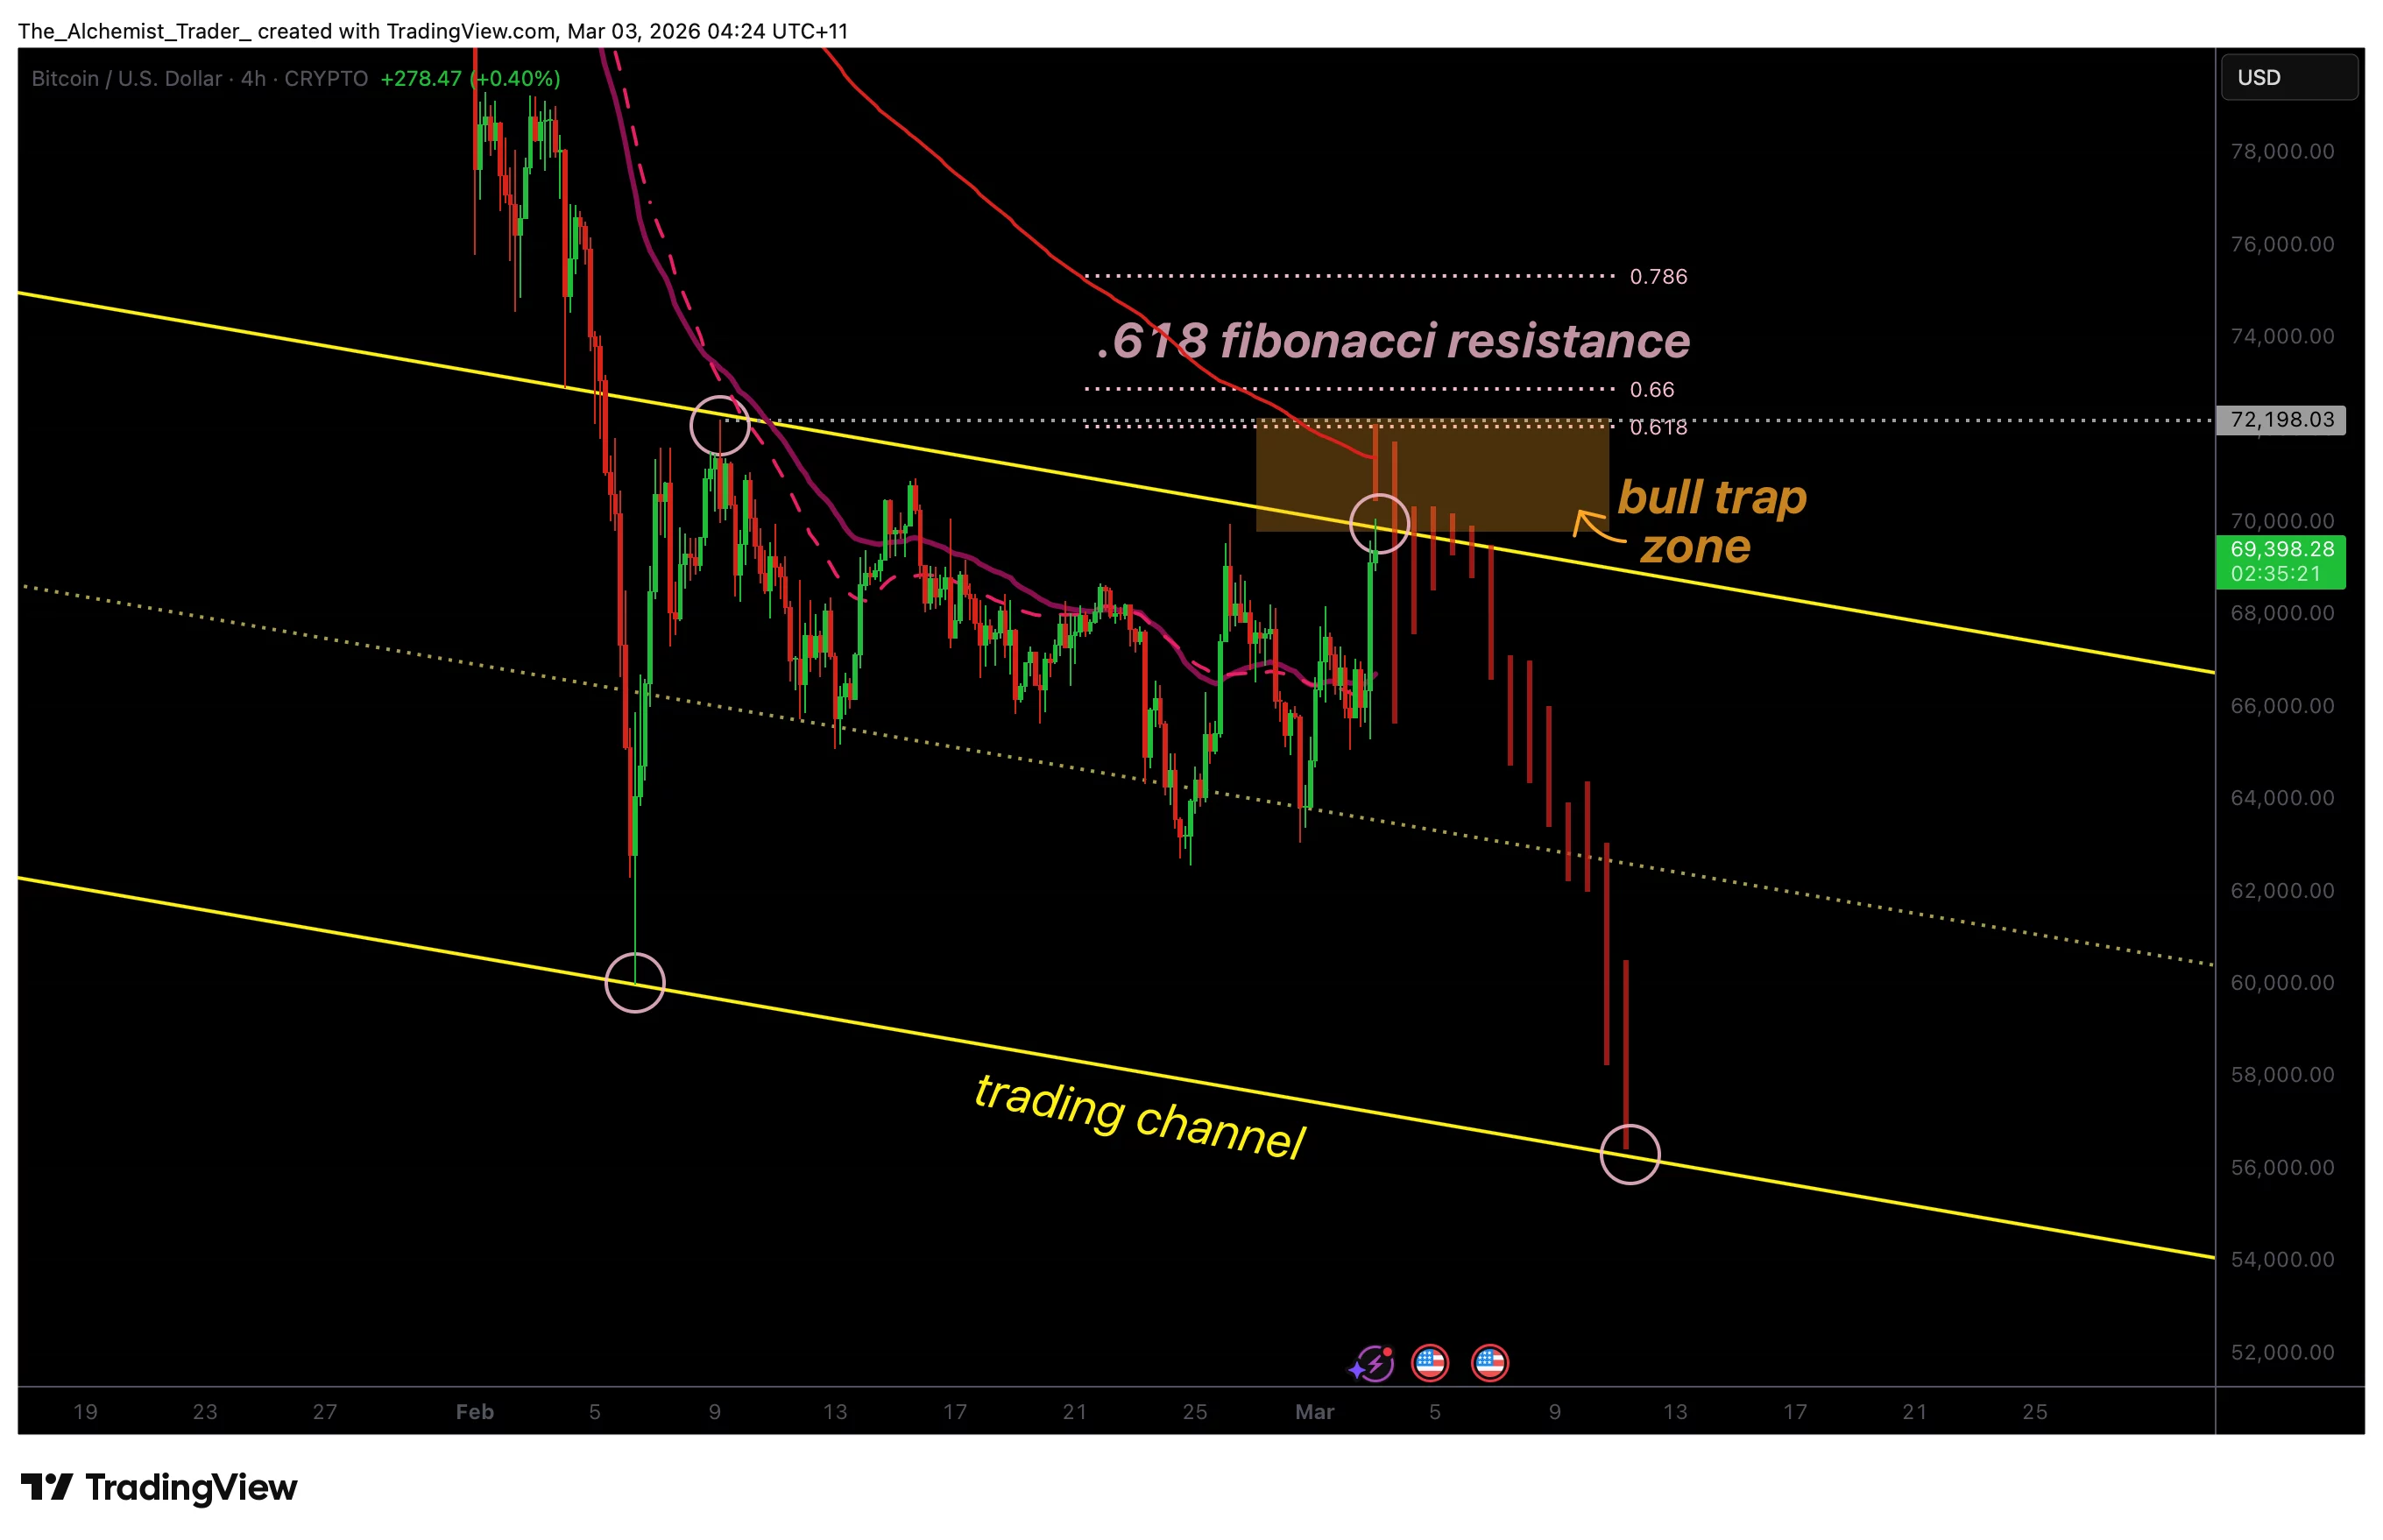
Bitcoin price recent rally has carried price above the channel midpoint, signaling short-term strength within the broader range. However, the move is now testing the upper channel boundary, an area that has repeatedly capped upside since $60,000 was established as the weekly low. This level represents a key structural ceiling within the ongoing consolidation phase.
Adding to the resistance confluence is the presence of a significant Fibonacci retracement level, which overlaps with a prior swing high and descending moving average resistance. When multiple technical indicators align within a narrow price zone, markets often react decisively. In this case, the overlapping resistance cluster increases the probability of rejection rather than breakout continuation.
Volume dynamics further reinforce caution. Despite the impulsive appearance of the rally, trading volume has steadily declined as price approaches resistance. Healthy breakouts typically require expanding participation to confirm strength.
Instead, fading volume suggests that buying pressure may be weakening, a classic precursor to bull trap scenarios, particularly as roughly 46% of Bitcoin supply is currently held at a loss, nearing levels seen during the 2022 bear market.
A bull trap typically forms when price briefly breaks above resistance, attracting breakout buyers, only to reverse sharply and close back below key levels. Should Bitcoin fail to hold above the channel high and instead fall back into the channel structure, it would signal weakness and confirm the trap setup. A bearish close back within the channel would likely shift momentum downward.
If rejection occurs, the next logical destination would be the lower boundary of the trading channel. Notably, the channel support has not been retested since the $60,000 weekly low was formed. Markets frequently revisit untested support zones to rebalance liquidity before determining the next major direction.
From a broader market structure perspective, Bitcoin remains range-bound rather than in confirmed bullish expansion. Without a decisive breakout supported by strong volume, rallies into resistance carry elevated failure risk.
The confluence of Fibonacci resistance, moving averages, and structural channel highs strengthens the argument that this zone may cap upside in the near term, particularly as Bitcoin navigates a defensive liquidity backdrop amid escalating US–Iran tensions and broader market volatility.
What to expect in the coming price action
Bitcoin’s rally remains vulnerable while testing confluence resistance with declining volume. A rejection from this zone would confirm a potential bull trap and increase the probability of a corrective move back toward channel support near $60,000.
Only a strong breakout with volume confirmation would shift the outlook decisively bullish.