
Shiba Inu is trading in a tightly wound setup as derivatives activity rises, whale positioning turns more aggressive, and price remains capped below a key macro resistance zone. The meme coin’s short-term indicators have improved, but leverage is increasingly driving the structure beneath the surface.
SHIB is currently roughly 17% below its 200-day moving average and still locked inside a broader downtrend. Year to date, the asset remains down 24.6%, while its annual decline stands at 54.15%. That macro backdrop is difficult to ignore.
Yet the near-term picture is less one-sided. SHIB gained 1.7% over 24 hours, while its RSI sat at a neutral 54.45 and the 24-hour MACD flashed bullish. Weekly performance was nearly flat at 0.1%, but that lack of directional movement came as derivatives activity expanded sharply, suggesting positioning is building before price has made a decisive move.
Shiba Inu Leverage Builds While Spot Volume Fades
The key shift is in open interest. SHIB’s open interest climbed to $37.63 million, up 15.73% over the week, even as 24-hour spot volume fell 11.49% to $32.99 million. That divergence points to a market where futures traders are becoming more active while spot participation remains subdued.

Related Reading
As Alphractal AI’s report framed it, “This divergence creates a leveraged consolidation environment where price coils while futures positions build. The OI-to-Market Cap ratio of 1.024% indicates moderate leverage saturation relative to SHIB’s float, leaving headroom for expansion before systemic risk escalates.”
That matters because SHIB’s $3.67 billion market capitalization is not yet being matched by a surge in spot velocity. Instead, derivatives appear to be carrying more of the price-discovery burden. For meme assets, that can turn quiet ranges into unstable structures: price may look flat, but positioning can become increasingly crowded.
The long-short ratio sits at 1.694, showing a bullish skew among futures traders without yet reaching euphoric levels. Liquidations remain minimal, with only $9.4K cleared over the past day, mostly from long positions at $6.2K. In other words, the leverage buildup has not yet been flushed.
Whales Lean In As Retail Steps Back
The more constructive signal comes from large-holder behavior. The Whale vs. Retail Delta stands at 1.875, indicating that whales are accumulating more aggressively while retail exposure weakens. Combined with a Top Trader Sentiment score of 2.74, the data suggests more sophisticated market participants are leaning long even as smaller traders reduce risk.
Related Reading
Alphractal described the setup as a “historically bullish contrarian” structure, adding: “The divergence between whale accumulation and flat price action often precedes directional breaks, particularly when OI expands concomitantly.”
Platform-classified market sentiment also reads “Bullish,” aligning with the whale and top-trader metrics. Still, the signal is not clean enough to call a confirmed breakout. The broader trend remains negative, spot volume is fading, and derivatives positioning can amplify downside as easily as upside if price fails to hold support.
The major levels to watch are the 20-week EMA ($0.00000683), the 50-week EMA ($0.0000092), the 100-week EMA ($0.00001168) and the 200-day EMA ($0.00001313) as well as red zones inside the weekly chart.
At press time, SHIB traded at $0.00000630.
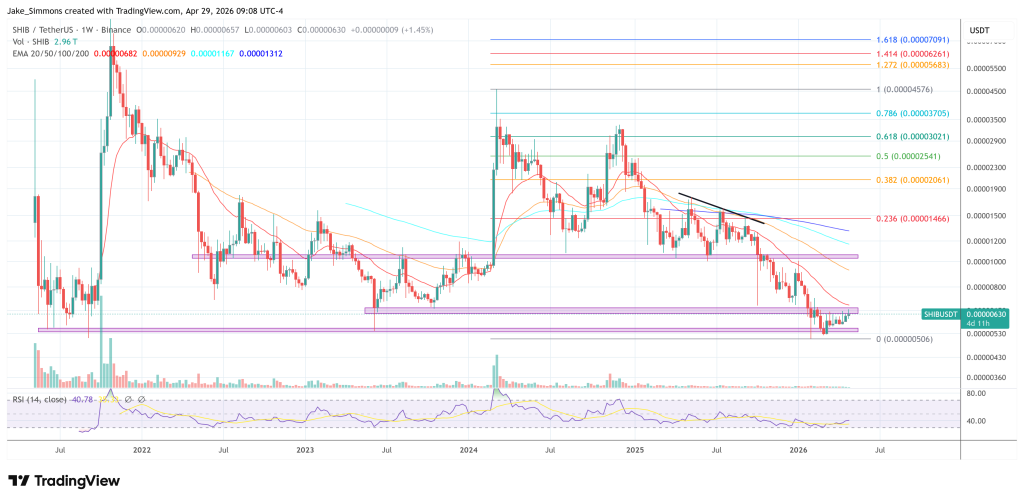
Featured image created with DALL.E, chart from TradingView.com