
Ethereum may be nearing a major inflection point, according to market analyst Ali Martinez (@alicharts on X), who argues that a confluence of technical structure and on-chain valuation data is beginning to tilt the setup back in bulls’ favor.
In a post on X, Martinez said Ethereum is showing signs of a “major structural shift,” pointing to a multi-year ascending triangle on the weekly chart, a recent test of support near $1,800, and a historically significant drop in the MVRV ratio. Taken together, the message was clear: the recent weakness may have looked less like a breakdown and more like a reset inside a larger bullish structure.
Ethereum’s Path To $10,000?
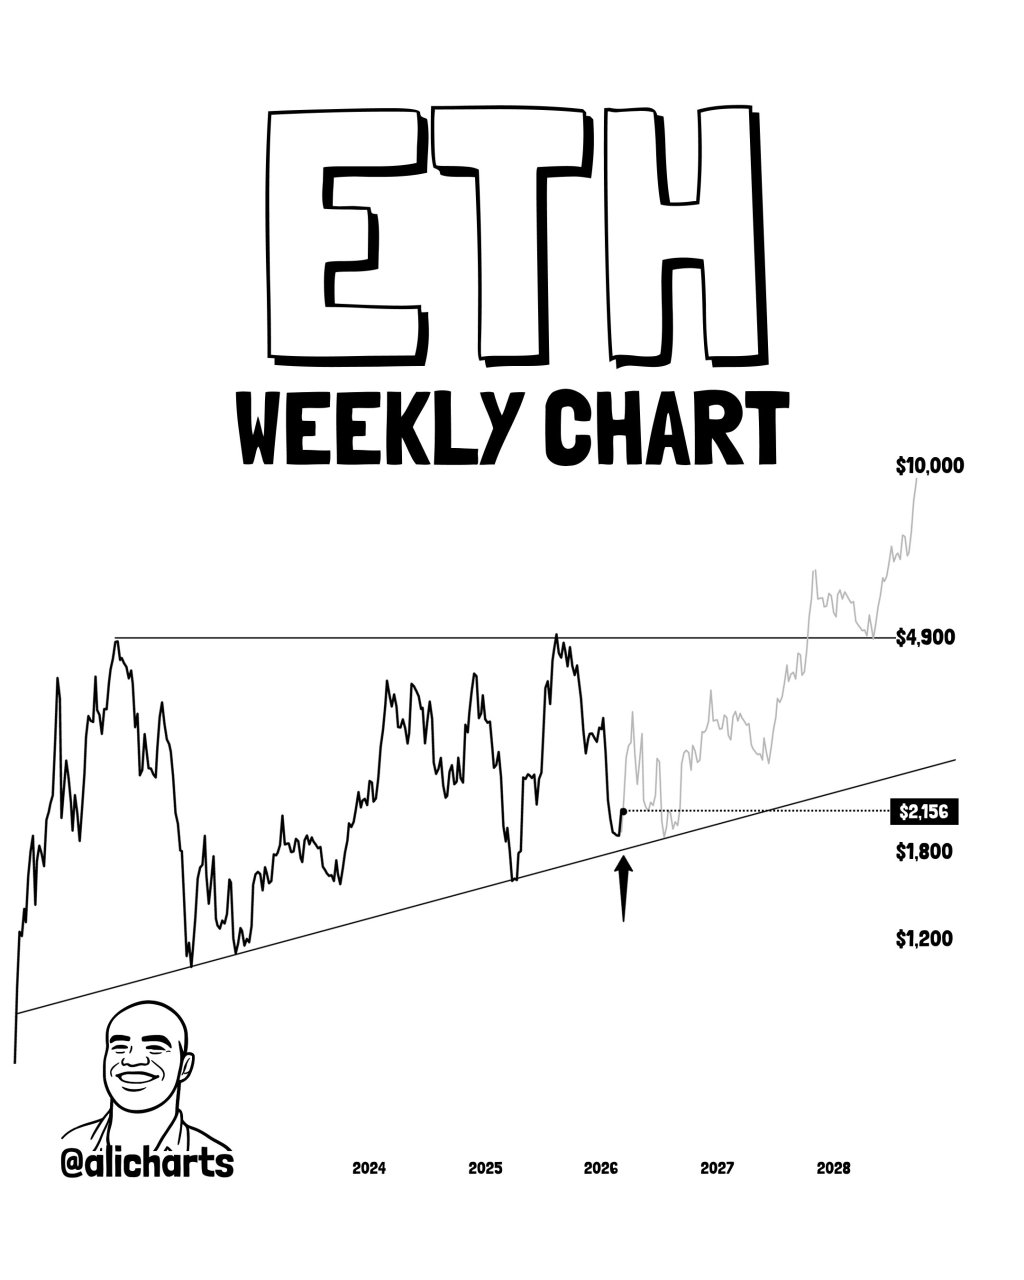
Martinez framed the chart setup as the backbone of the thesis. “From a technical standpoint, ETH continues to trade within a well-defined ascending triangle on the weekly chart,” he wrote. “The recent move toward $1,800 served as a critical reaction point, aligning with the rising trendline of this multi-year structure.” In other words, the analyst is not treating the bounce as an isolated event. The relevance comes from where it happened: directly at a level he views as structurally important in the context of a long-duration pattern.
Related Reading

That technical argument was paired with an on-chain signal Martinez described as even more consequential. He said Ethereum’s MVRV ratio recently fell below 0.8, a threshold he characterized as a rare valuation reset. “Historically, this is a ‘Generational Buy’ zone. We saw similar resets before the major bull rallies of the past,” he wrote. “The fact that this on-chain reset happened exactly as price tested the triangle’s support adds massive weight to the bullish thesis.”
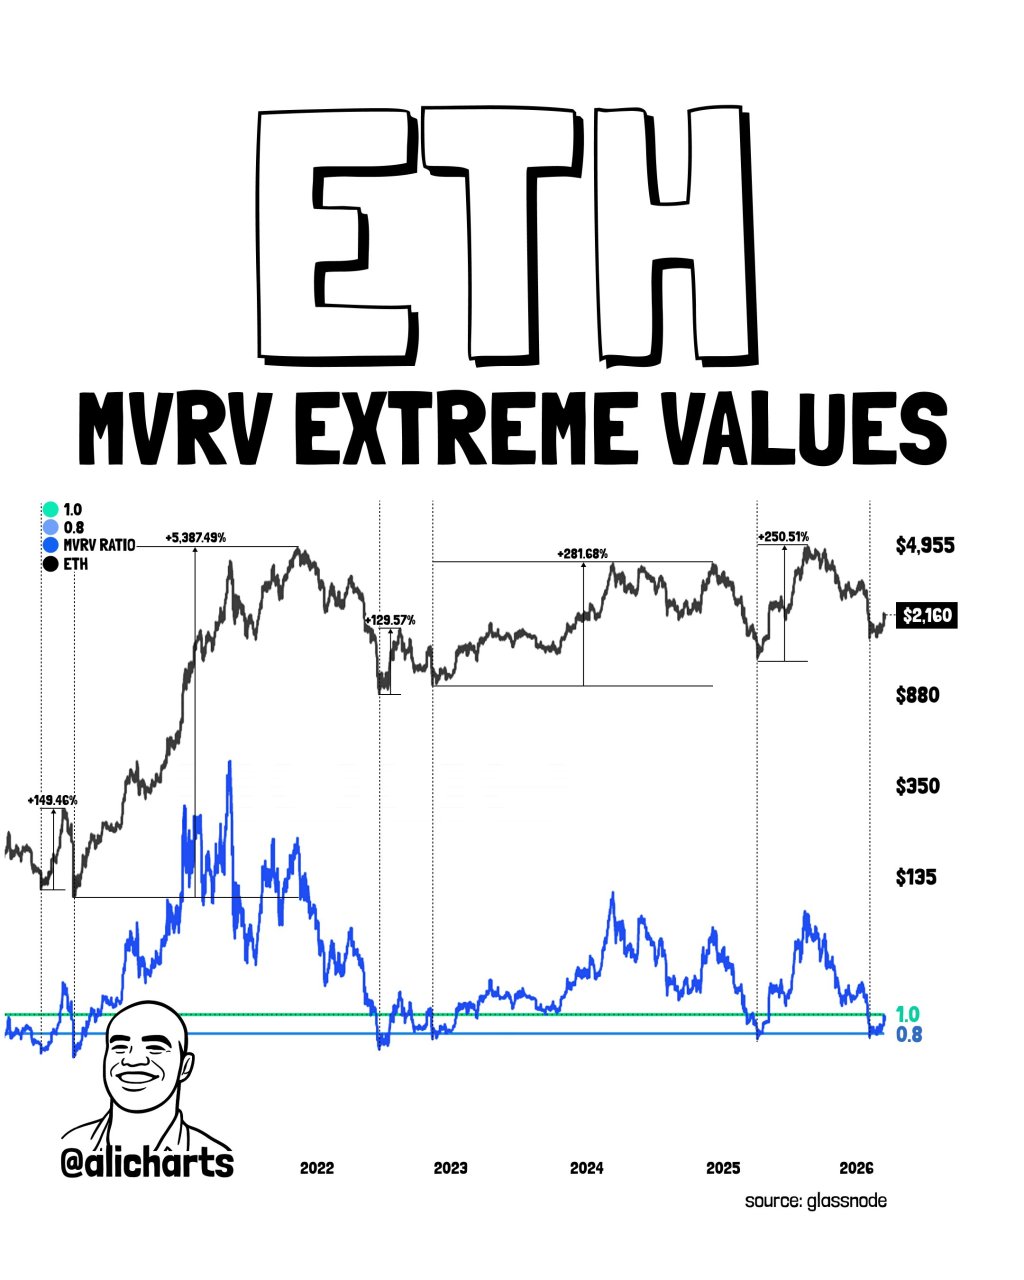
The logic of the call rests on that overlap. A chart support test on its own can invite skepticism, especially after prolonged weakness. But Martinez’ argument is that Ethereum is not only holding a key structural zone; it is doing so while on-chain data suggests the asset has entered an area associated with deep undervaluation in previous cycles. That does not guarantee a trend reversal, but it does sharpen the significance of the current range.
Related Reading
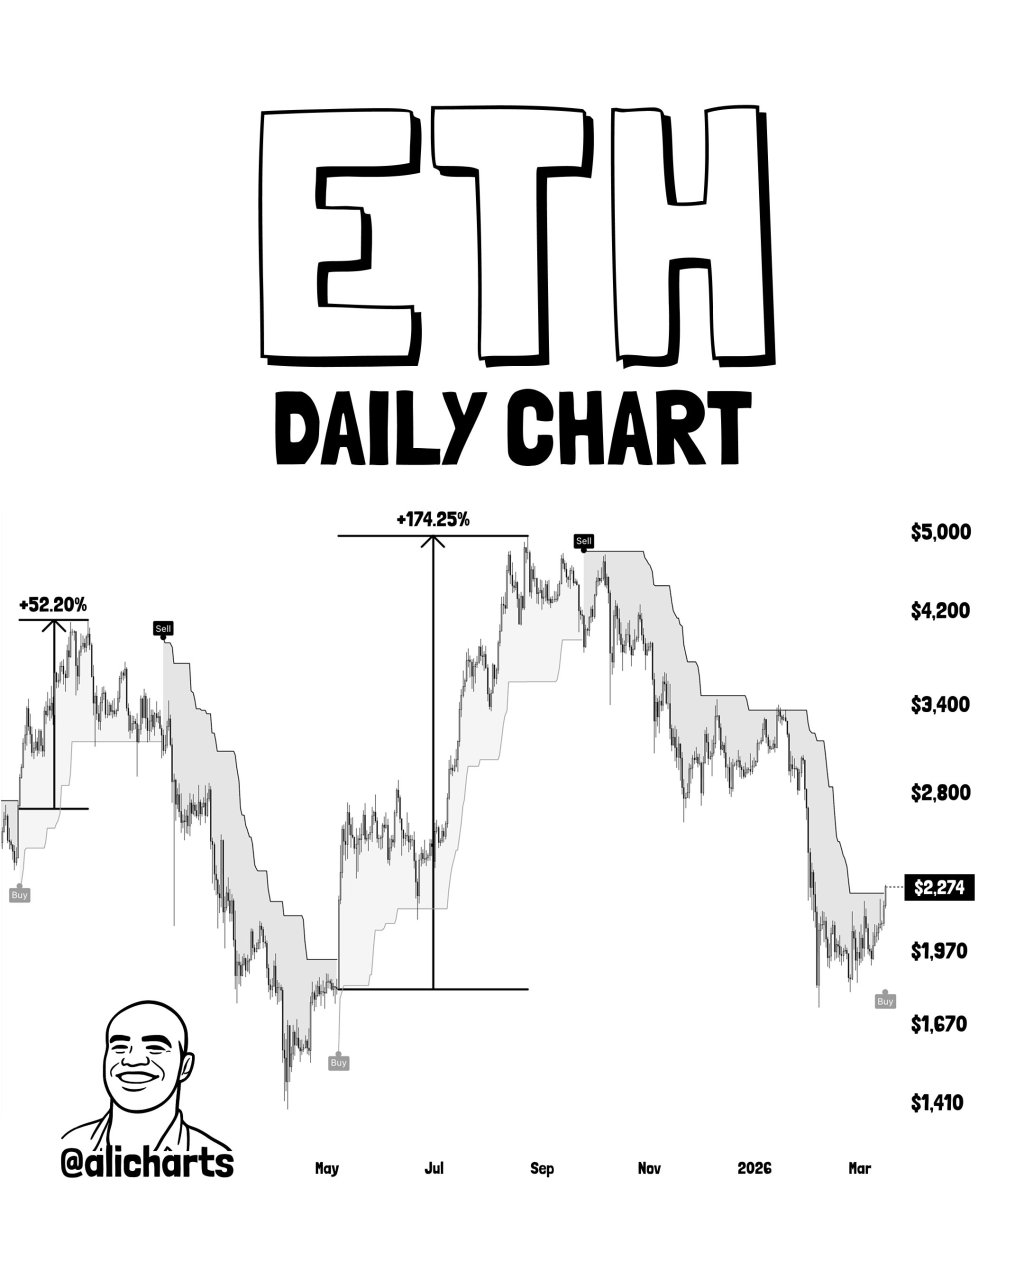
He also pointed to a momentum shift on lower timeframes. According to Martinez, the daily Supertrend indicator has now turned green for the first time since May of last year, suggesting the long stretch of consolidation may be giving way to a new directional move. In his telling, the market is moving out of a “sideways grind” and beginning to rebuild upward momentum.
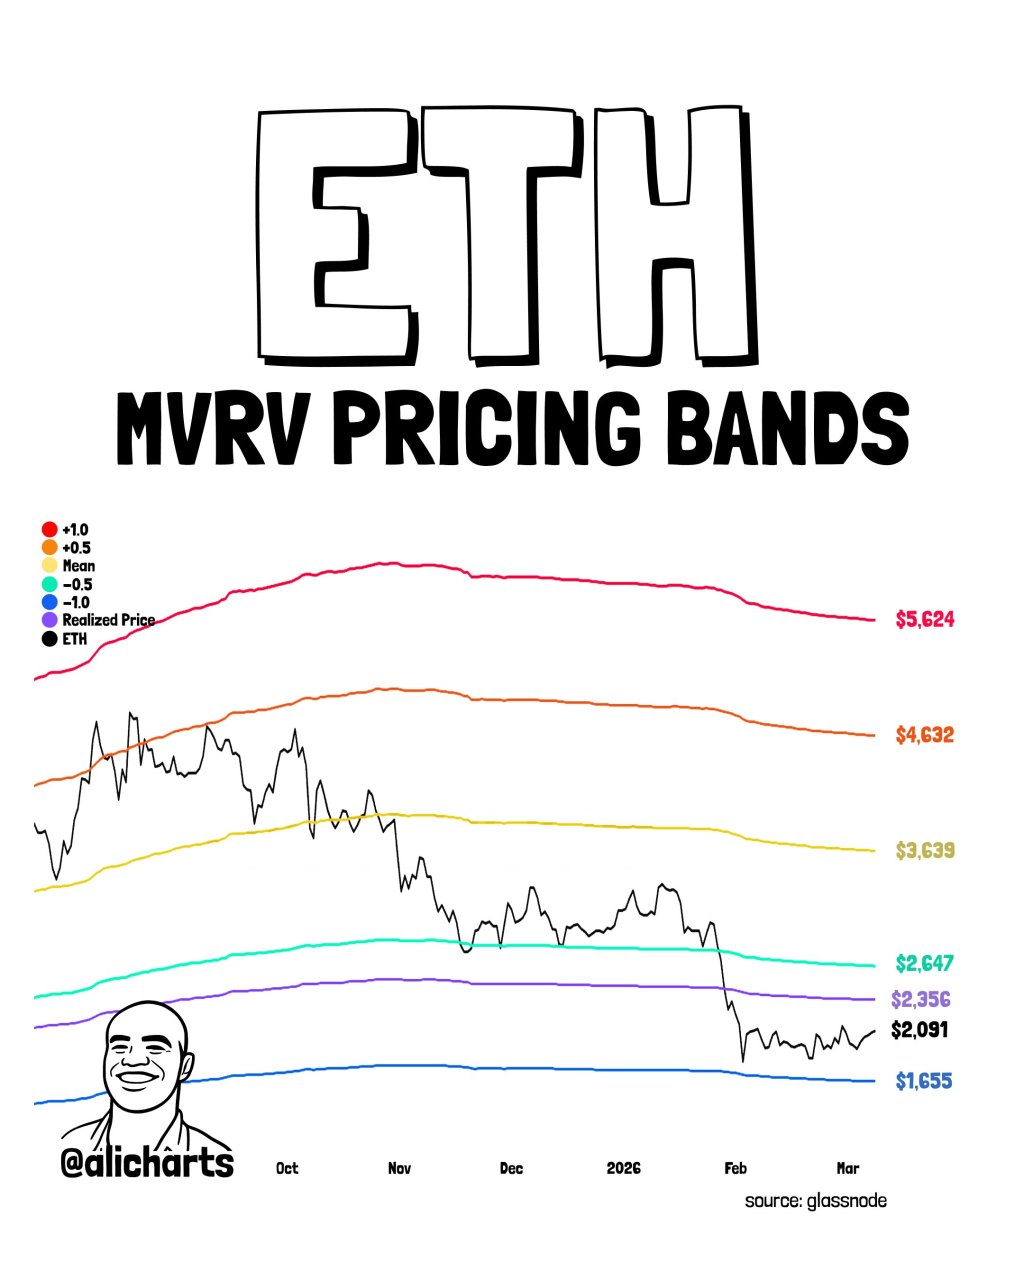
From there, Martinez laid out the price levels that could define whether the thesis holds. He identified $2,356 as the first major level Ethereum needs to reclaim, followed by $2,647 and $3,639 as mid-term breakout targets. Beyond that, he marked $4,632 and $5,624 as longer-term expansion zones.
The larger prize, however, sits further out. “A sustained move above $2,356 would be our first confirmation that ETH is moving out of ‘accumulation’ and into a true bull market expansion,” he wrote. “If it can clear the previous all-time high region near $4,900, the door opens for a move toward $10,000, as it will signal a breakout of the ascending triangle.”
For now, the thesis remains conditional rather than complete. Martinez described the $2,000 to $1,800 range as a “prime accumulation zone,” while adding that the bull market is not “guaranteed” yet.
That caveat matters. His case for a durable bottom depends on Ethereum holding the $1,800 floor and then reclaiming higher resistance levels in sequence. If that happens, the current setup could be remembered as an early-stage reaccumulation phase rather than just another bounce inside a broader range.
At press time, ETH traded at $2,054.

Featured image created with DALL.E, chart from TradingView.com