
Bitcoin’s five-year compound annual growth rate has slipped below gold’s for the second time in its history, according to Fidelity Digital Assets, marking an unusual moment for an asset long defined by its outsized long-term returns. For markets, the signal is not just about relative performance against gold, but about what a slower growth profile may say about Bitcoin’s current market cycle.
In a new Chart Chatter segment posted on X, Fidelity Digital Assets research analyst Zack Wainwright said Bitcoin’s five-year CAGR has been trending lower over time as the asset’s price has risen. That dynamic, he argued, has now produced a rare crossover. “What we are seeing now in early 2026 is Bitcoin’s CAGR falling below Gold’s 5-year CAGR for just the second time in Bitcoin’s history,” Wainwright said. “We have now seen three straight months to start the year of CAGR below Gold’s.”
What This Means For Bitcoin
That is the key statistic in Fidelity’s framing. Bitcoin has spent most of its history comfortably ahead of gold on a five-year compounded basis, which made the January break notable on its own. The fact that it has now persisted for three consecutive months gives the move more weight, especially coming at a time Fidelity explicitly describes as a bear market.
Related Reading

Wainwright tied the last comparable episode to the end of the previous cycle. “Back in 2022, we saw one such month of this occurring in December 2022, when Bitcoin’s price was bottoming out in the bear market around $15,000,” he said. “We are now once again in a bear market and below that CAGR for a longer stretch this time of three months.”
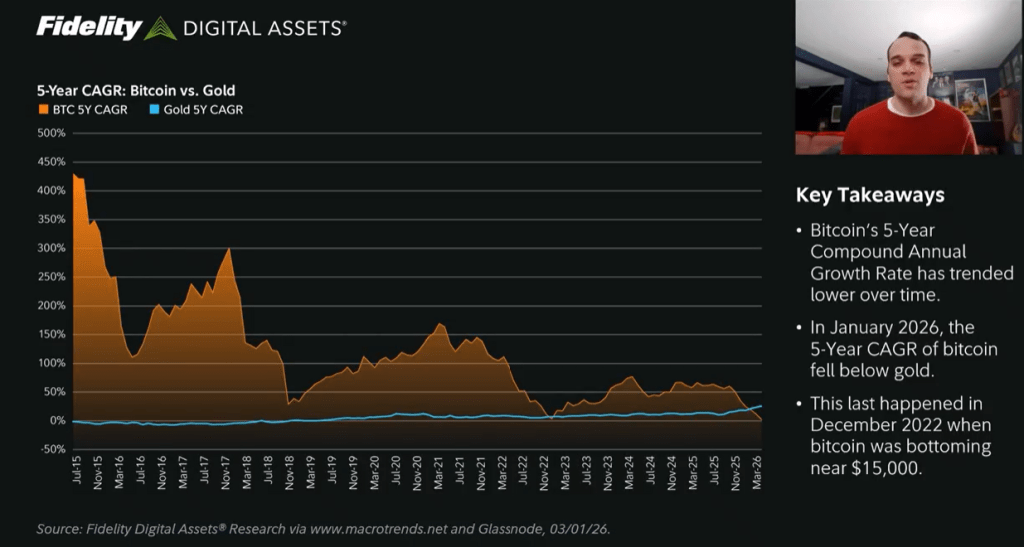
In Fidelity’s telling, the drop below gold is rare, but it has also happened before during a moment of acute market weakness. The difference this time is duration. One month in late 2022 could be dismissed as a brief distortion near a cycle low. Three straight months in early 2026 suggests a more sustained compression in Bitcoin’s long-term return profile.
At the same time, Fidelity did not frame the crossover as evidence that Bitcoin has lost its defining edge altogether. Wainwright was careful to stress the historical balance. “Overall, Bitcoin has remained above Gold’s CAGR for the majority of its history,” he said. “So this is truly a unique instance and occurrence in Bitcoin, where it is now below the CAGR of Gold.”
Related Reading
Gold’s side of the comparison is important too. Spot gold closed at $2,156.61 per ounce on March 18, 2024, then climbed to $2,999.96 on March 18, 2025, and stood at $5,012.45 on March 17, 2026. That translates into a gain of about 67.1% over the past year and roughly 132.4% over two years — a surge that helps explain why Bitcoin’s five-year CAGR has now slipped below gold’s.
For now, the takeaway is straightforward: Bitcoin still has the stronger long-run record against gold across most of its history, but early 2026 has produced a rare exception. Whether that proves to be another late-bear-market anomaly or an early sign of a more mature, slower-growth Bitcoin is the question Fidelity has now put squarely in front of the market.
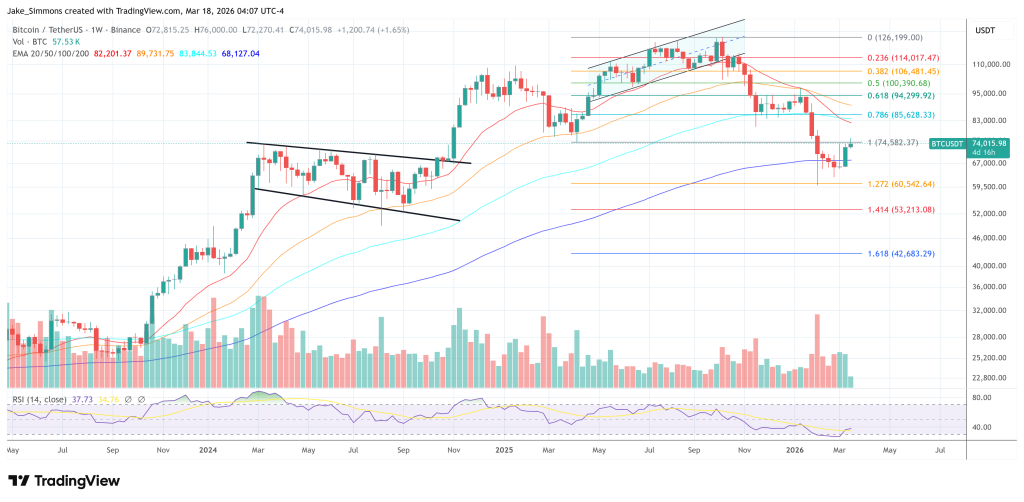
At press time, BTC traded at $74,015.
Featured image created with DALL.E, chart from TradingView.com