


Bitcoin (BTC) has been counting down to its next bottom for nearly two months, a classic onchain metric suggests.
Key points:
- BTC supply in loss passed 50% for the first time this bear market in early June.
- In previous bear markets, that event sparked a countdown to a new BTC price macro bottom.
- Separate data hints that the bull market’s “emotional premium” has now gone.
Supply in loss countdown already Bitcoin’s second-longest
In its H1 2026 Round-Up report, crypto research company K33 Research flagged more than 50% of the BTC supply now being held at a loss.
A typical bear-market feature, supply in loss has become a yardstick for progress toward macro bottoms for BTC/USD.

K33 data shows that once supply in loss passes the 50% mark, the bottom has come no more than 101 days later. Bear markets have provided various time frames, with the shortest bottom “window” lasting just 13 days in 2022.
The 2018 bear market required 23 days to reach its floor, while in 2014, Bitcoin continued to decline for 101 days after the 50% supply-in-loss mark was hit.
In 2026, supply in loss repeated standard bear-market behavior, crossing 50% on June 5. Since then, 42 days have elapsed, making this year’s bottom window Bitcoin’s second-longest ever.
BTC supply in loss and days until bear-market bottom (screenshot). Source: K33 Research
In accompanying commentary, K33 observed that returns over the year following the phenomenon “tend to be very solid.”
Earlier this month, Axel Adler Jr., a contributor to onchain analytics platform CryptoQuant, estimated that supply in loss was around two months away from levels that correspond to bear-market bottoms.
CryptoQuant data puts supply in loss at 46% as of July 17.
“Distribution of capital” teases silver lining
Continuing, CryptoQuant eyed what it described as “rare” readings from Bitcoin investor cost-basis models.
Related: Bitcoin $107K buyers providing ‘early signals’ of 2026 bear-market bottom: Glassnode
The realized cap variance (RCV) model, which measures the difference between realized cap and market cap, currently sits in the bottom 6% of its historical range.
“Instead of tracking price alone, it isolates the variance between realized cap and market cap relative to its own rolling history, capturing how stretched or compressed investor cost basis has become versus current valuation,” contributor Crazzyblockk explained in a QuickTake blog post on Thursday.
“When that variance compresses into deeply negative z-score territory, the emotional premium built during rallies has largely been priced out. The metric doesn’t read narrative, it reads the distribution of capital.”
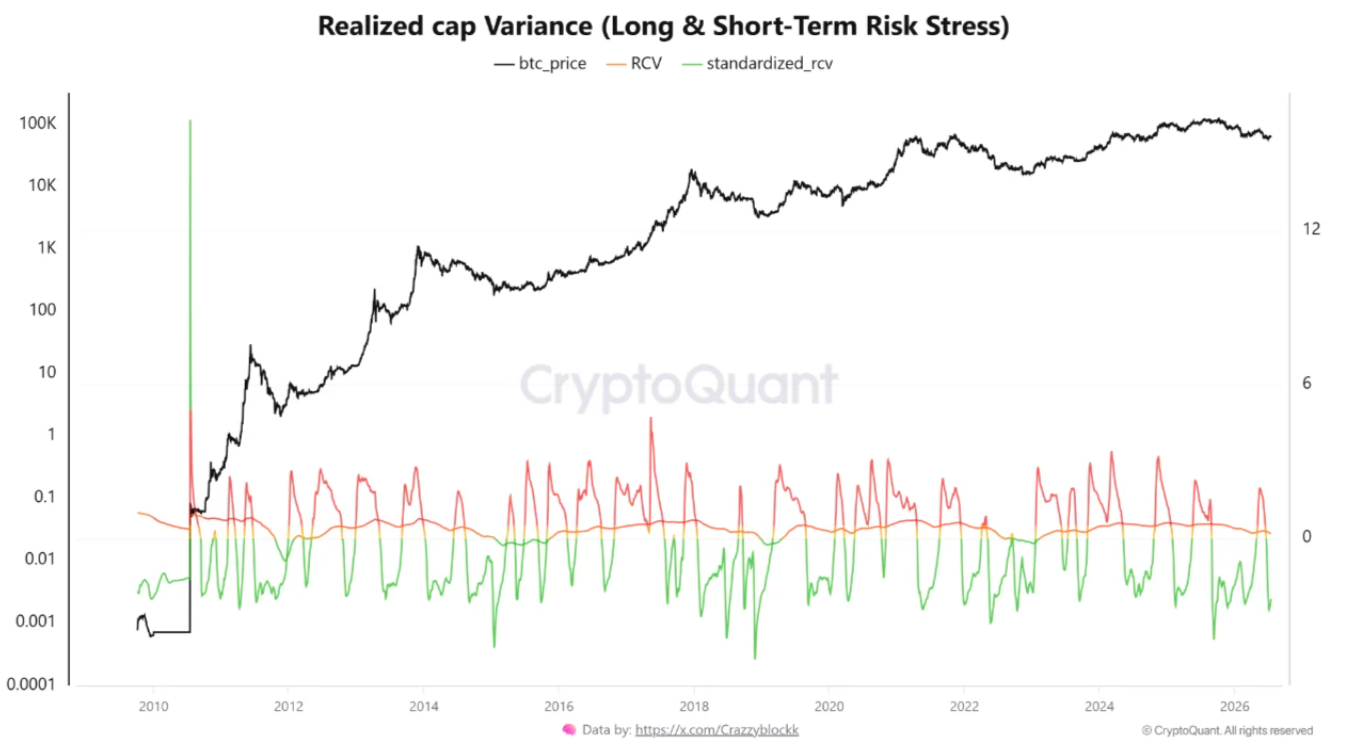
Bitcoin RCV data (screenshot). Source: CryptoQuant
At -2.35, standardized RCV’s Z-score is once again pointing to the final stages of the Bitcoin bear market.
“Every prior stretch where the model spent extended time below a -2.0 z-score, late 2018, mid-2022, early 2015, preceded forward twelve-month returns north of 75%,” the post noted.
“The most extreme reading in this dataset, -4.68 in November 2018, landed almost exactly on Bitcoin’s cycle bottom near $3,792.”