

A crypto analyst, who publishes technical analysis to his audience on X, has released a zoomed-out weekly Ethereum chart that interprets the current price weakness as the final stage of a multi-year accumulation cycle. As it stands, the Ethereum price is trading around $2,100 and 57% below its peak. Therefore, the technical analysis is suggesting that the cryptocurrency is in an accumulation zone, one that is setting up a price move to as high as $20,000.
The Accumulation Blueprint Playing Out On ETH’s Weekly Chart
The weekly ETH/USDT chart posted by Crypto Patel on X illustrates a structured price pattern that has been developing since 2024. The chart identifies a Selling Climax (SC) in early 2024, followed by an Automatic Rally (AR) to resistance within two months, and then a Secondary Test (ST) of the Selling Climax in mid-2024.

These are all terminologies of a Wyckoff blueprint, and this has created the sequence of price events that established the boundaries of the current trading range. There is a horizontal resistance line around $4,700 at the top of that range, while Support 1, at $1,549, represents the bottom.
There are also two notable downside wicks labeled as Spring 1 and Spring 2, both of which are situated around Support Spring 1, which occurred in mid-2025 and saw the Ethereum price fall below Support 1 very briefly before recovering and pushing back to a new all-time high just above the resistance line.
Since then, however, the Ethereum price has been on a downside path, and the current price action is labeled as Spring 2, which is just above Support 1. If Support 1 breaks down, the next intended buy zone is Support 2 at $1,065. It is within the projected fall to Support 2 where Crypto Patel identifies the $1,800 to $1,400 range as the best buying and accumulation zone.
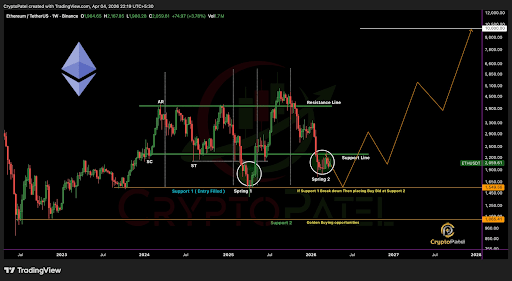
Ethereum Price Chart. Source: @CryptoPatel On X
Price Move To $20,000
The ETH accumulation map projects a price rally to as high as $20,000 after Ethereum breaks out of the accumulation zone. This rally is, however, contingent on a big resistance / breakout level around $4,700.
Crypto Patel’s projected targets ($10,000, $15,000, and $20,000) are plotted on the chart as a staged upside trajectory extending into late 2027 and 2028. The projected rally shows a rally from the current accumulation zone to $4,700, a pullback below $4,000 to consolidate the breakout, and then a parabolic extension to new all-time highs as high as $10,000 before continuing higher to $15,000 and $20,000.
A $20,000 price target for Ethereum would represent about a 10x return from the current price, which is trading at $2,135, up by 4.8% in the past 24 hours.
Featured image from Getty Images, chart from Tradingview.com
Editorial Process for bitcoinist is centered on delivering thoroughly researched, accurate, and unbiased content. We uphold strict sourcing standards, and each page undergoes diligent review by our team of top technology experts and seasoned editors. This process ensures the integrity, relevance, and value of our content for our readers.