


Dogecoin (DOGE) is approaching a decisive technical moment as price pressure across the broader market keeps the memecoin pinned near key support zones. After slipping below the psychological $0.10 level, traders are now watching whether DOGE can stabilize or whether the ongoing downtrend will extend further.
Related Reading: Here’s What’s Driving The Bitcoin Price Crash Toward $60,0000
Dogecoin currently trades around the low-$0.09 range after posting steady losses across multiple timeframes. Market data shows the token has declined sharply over the past month, reflecting reduced risk appetite and continued selling pressure across digital assets.
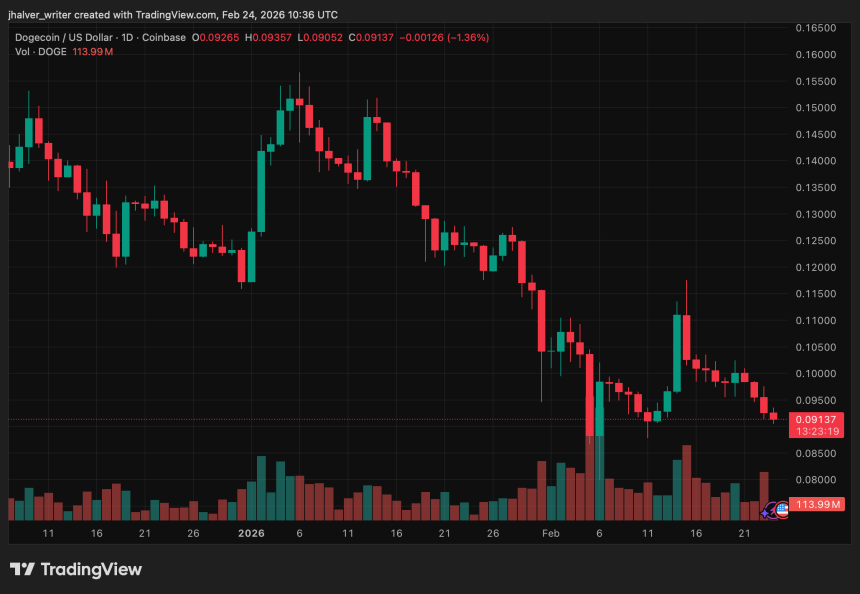

DOGE's price trends to the downside on the daily chart. Source: DOGEUSD on Tradingview
Dogecoin Price Struggles Below Key Moving Averages
Technically, Dogecoin remains in a clear corrective phase. Price action continues to trade below the 50-day EMA, currently acting as strong dynamic resistance near the $0.11–$0.12 region. Repeated rejection at this level has reinforced a pattern of lower highs and lower lows that has persisted since late 2025.
Momentum indicators present mixed signals. The RSI is near oversold territory, suggesting selling pressure may be easing, while trend-strength indicators still confirm a dominant bearish structure. Analysts note that volatility has also compressed following recent declines.
Short-term charts show resistance clustered between $0.095 and $0.10, while immediate support lies near $0.091 and $0.088. A break below these levels could expose deeper downside targets toward the $0.083–$0.080 region.
Bear Flag Risks vs. Rebound Potential
Adding to the uncertainty, daily charts show DOGE consolidating within a bearish flag, a pattern typically associated with a continuation move lower. Some projections suggest a potential decline toward the $0.065–$0.07 zone if support fails.
However, not all signals are bearish. A long-term cycle metric, tracking the number of historical trading days above the current price, has reached a record level. Similar readings previously appeared near major market bottoms in 2020 and 2023, both followed by strong rallies.
Analysts caution that this is a structural indicator rather than a short-term timing signal, but it has drawn renewed attention from long-term investors.
Meanwhile, a shorter-term analysis shows DOGE rebounding from oversold RSI levels, with some traders targeting a move toward $0.115–$0.119 if buyers regain control.
Key Levels Traders Are Watching
For sentiment to shift meaningfully, Dogecoin must reclaim the $0.095–$0.10 zone and eventually break above the 50-day EMA. Failure to do so would keep downside risks intact, particularly if macro risk-off conditions persist.
Related Reading: Bitcoin Capitulation Persists As Short-Term Holders Realize $0.48B Daily Losses
In the near term, the market remains balanced between potential accumulation and continued distribution. Whether Dogecoin stages a recovery or slides into a deeper pullback will likely depend on how the price reacts around current support, making the coming sessions critical for confirming the next trend direction.
Cover image from ChatGPT, DOGEUSD chart on Tradingview