
A crypto analyst has identified a Golden Triangle, a rare structure that has been forming on the Ethereum (ETH) chart for almost nine years. According to the analyst, the Ethereum price has remained within this triangle during both bullish and bearish periods.
However, he says the cryptocurrency is now approaching the apex of the triangle pattern, signaling an upcoming breakout either to the upside or downside. Depending on the direction of that breakout, the analyst has forecast ETH’s next move and possible price target.
Related Reading
Ethereum Golden Triangle Could Trigger A Surge To $10,000
A market analyst identified as ‘Merlijn The Trader’ on X has shared a new Ethereum price analysis, presenting both bullish and bearish scenarios. In a post shared on April 24, Merlijn said the Ethereum price is currently trading within a Golden Triangle pattern that has maintained its structure since 2017, two years after the cryptocurrency launched in 2015.

According to the analyst, the pattern has withstood several major events that caused sharp price swings during all those. He pointed to the 2020 COVID crisis, when most cryptocurrencies suffered steep declines, including ETH, which also crashed significantly. Even so, he noted that Ethereum continued to hold within the Golden Triangle.
The same pattern remained intact during the 2022 bear market, which followed ETH’s explosive surge to an all-time high above $4,800 in 2021. He added that even after reaching a peak in 2026 and undergoing another major correction, Ethereum remained within the triangle without breaking its structure.
Because the structure has held firm through all these bullish and bearish events, Merlijn believes ETH could now be approaching a decisive breakout from the nine-year formation. Looking at his accompanying chart, he noted that ETH is moving closer to the apex, the highest point, of its Golden Triangle, where a breakout often occurs.
Once the price reaches this apex, two outcomes are possible: Ethereum could either break upward or move lower through the bottom of the structure.
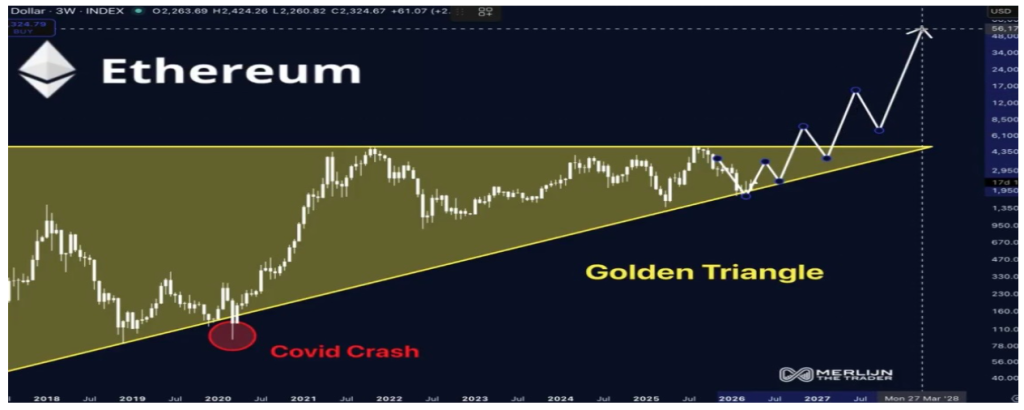
In his bullish case, Merlijn believes an upside breakout could send ETH above $4,350 and push its price toward a measured target of around $10,000. Given how long the triangle has held, he expects Ethereum to continue trending higher, with occasional pullbacks, until eventually reaching an ambitious peak above $56,000. He placed this longer-term price target in 2028, suggesting the rally could extend over the next two years.
ETH Bear Case If Price Breaks Below Triangle
For his bear case scenario, Merlijn The Trader noted that if Ethereum decides to go the opposite direction to break below the triangle, that move could trigger a decline toward $1,950. Currently, Ethereum is trading above $2,300, following its latest rally that saw it surge over 36%.
Related Reading
If the cryptocurrency declines to $1,950, it would mark a more than 15% drop from current prices. Even so, despite outlining this downside risk, Merlijn remains confident that a breakout to the upside may be the likely scenario.
Featured image from Unsplash, chart from TradingView