
Bitcoin is trading around $78k, surging higher consistently as a combination of improving technical structure and renewed geopolitical optimism drives fresh buying.
The extension of the US-Iran ceasefire has provided a meaningful risk-on catalyst, removing a key source of macro uncertainty that had been weighing on markets for weeks and giving buyers the fundamental backdrop they needed to push through key resistance levels.
Bitcoin Price Analysis: The Daily Chart
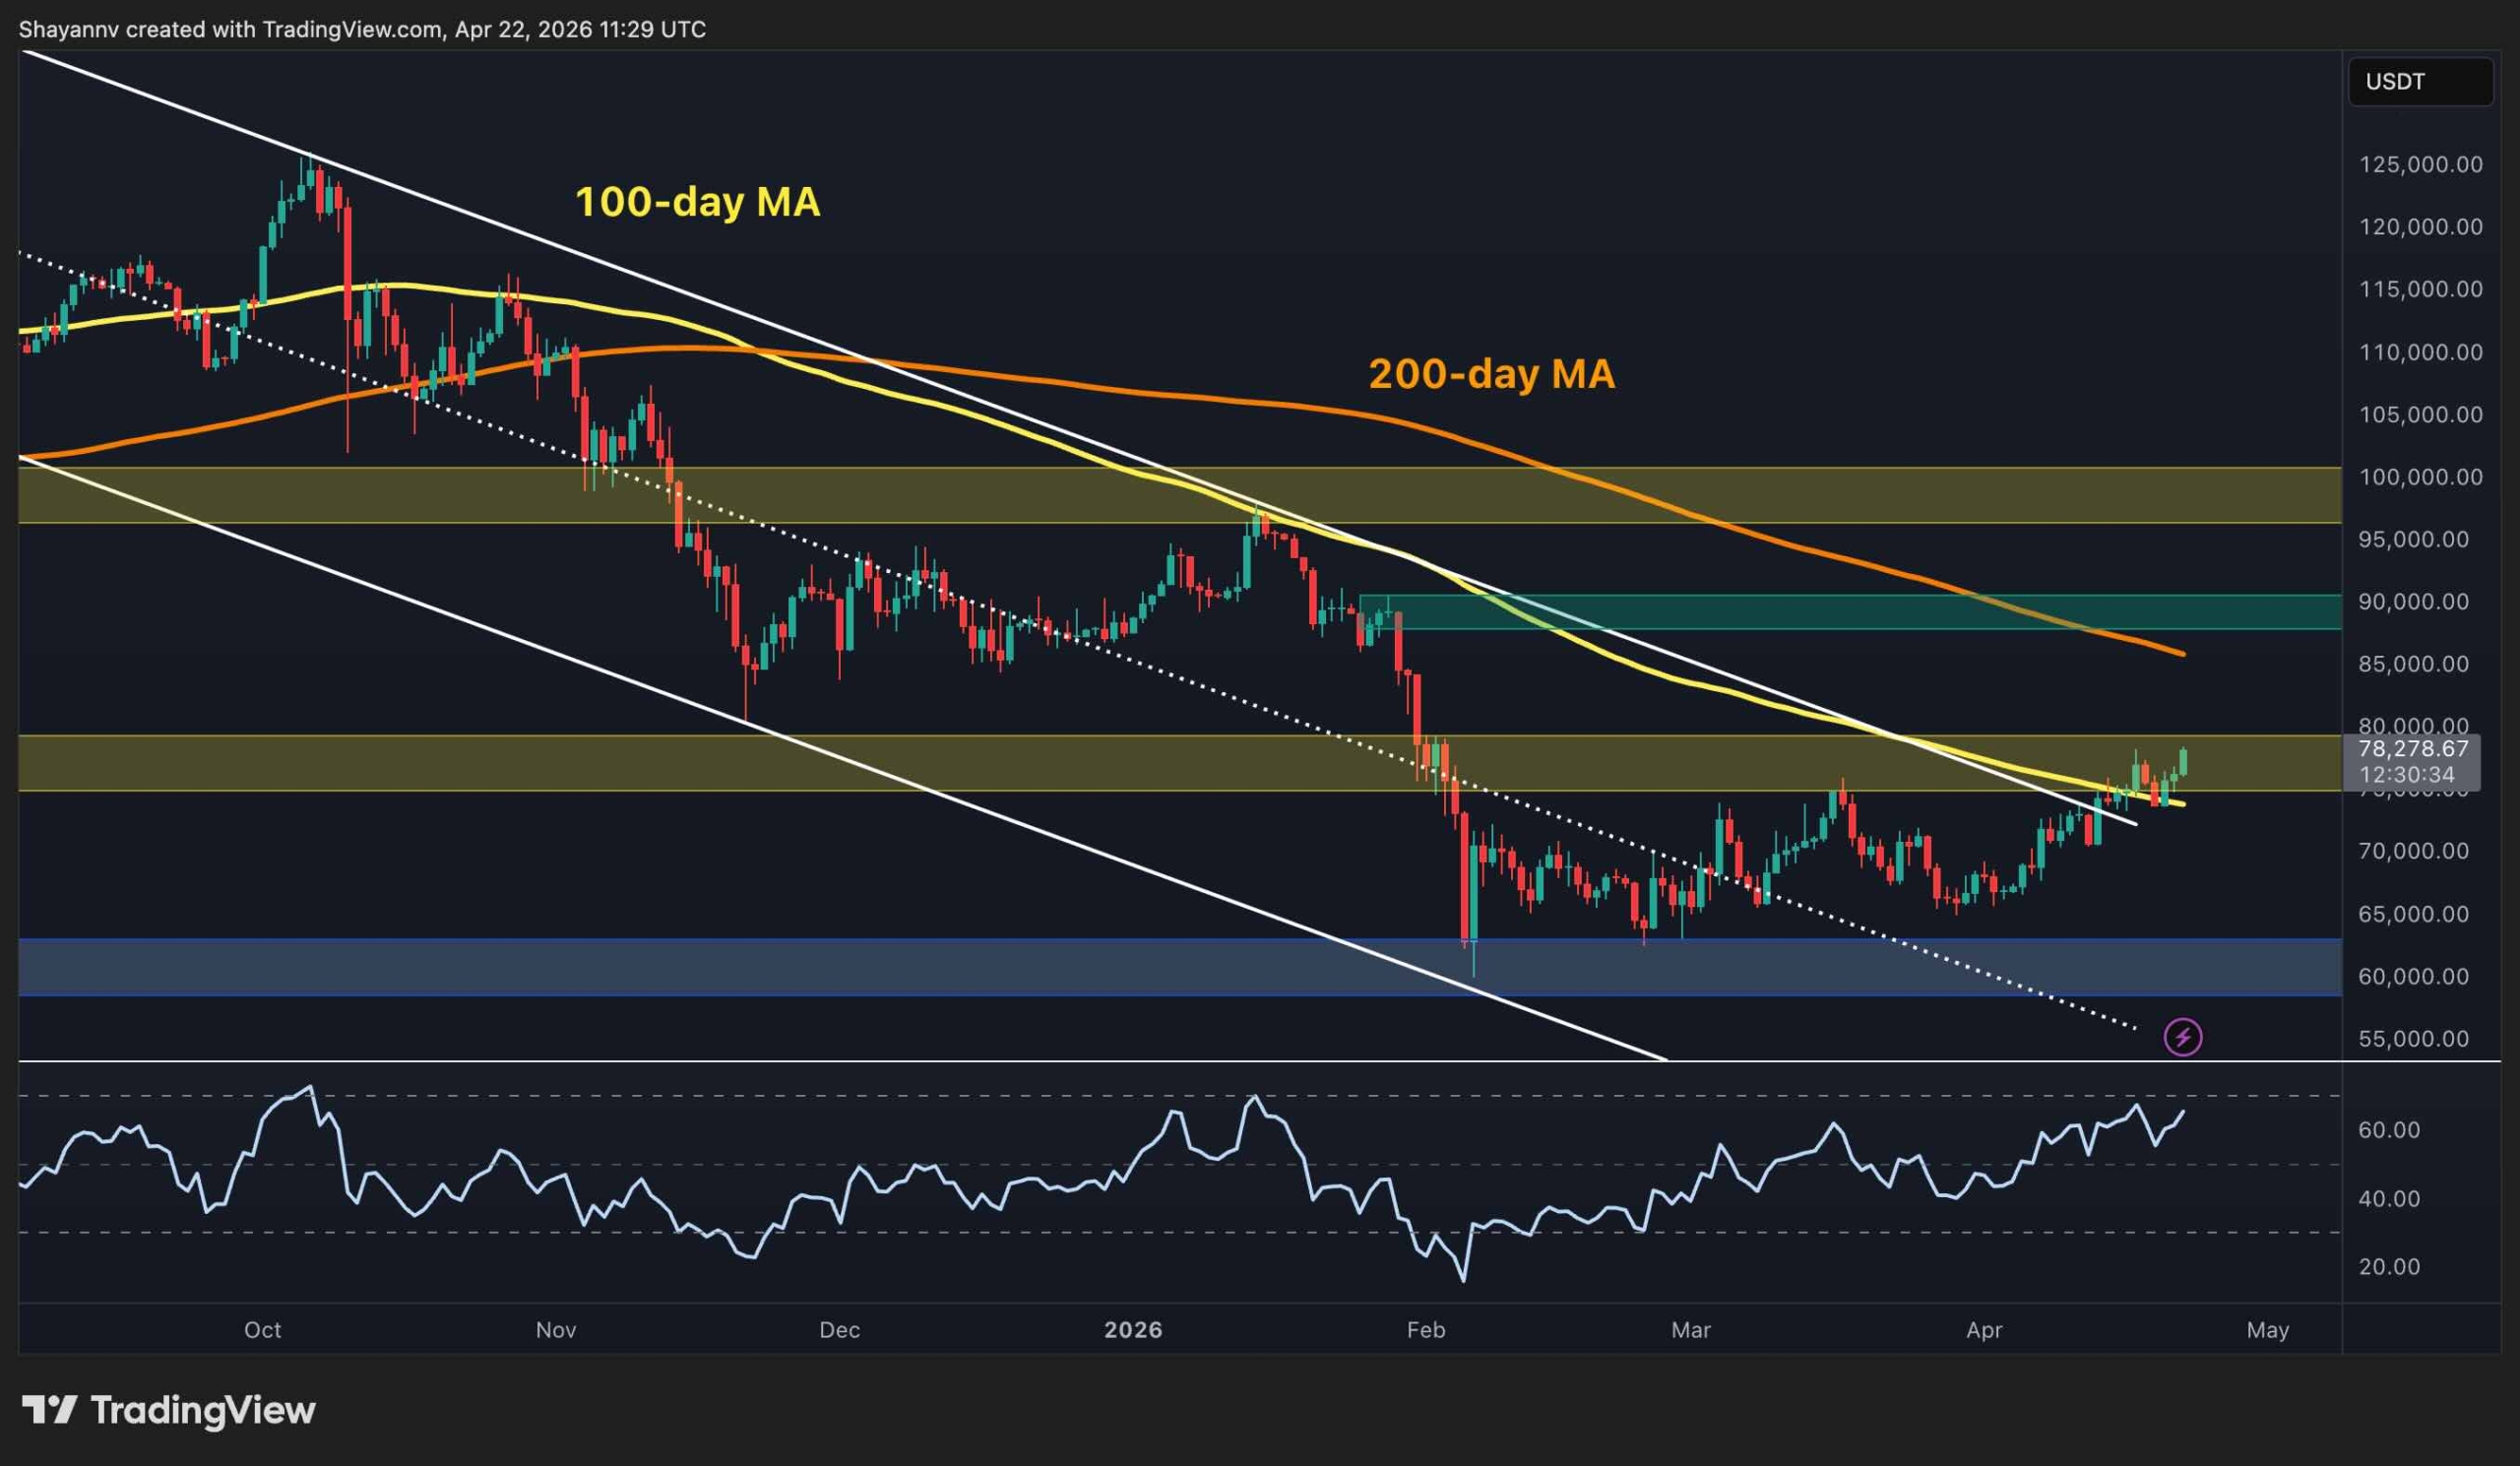
The daily chart is telling a different story than it was even a week ago. BTC has finally broken above the descending channel, cleared the 100-day MA around $75k, and is now pushing through the $75k–$80k resistance band, with the RSI also on the rise but not overbought yet. Crucially, what makes this move stand apart from previous attempts is that price is not just tagging resistance and fading. The price is grinding through the supply zone with successive higher closes.
The next major test sits at the $85k–$90k zone, where the declining 200-day MA and a significant supply cluster converge. A weekly close above the $80k psychological level would be a structural development of real importance, as it confirms that the correction’s dominant trend has broken down. On the downside, the former channel boundary and 100-day MA near $75k are now the first support levels to defend on any pullback.
BTC/USDT 4-Hour Chart
The ascending channel from the February lows is not producing a clean breakout to the upside. BTC is pushing through the upper boundary near $78k. Unlike the mid-March attempt and last week’s failed breakout, this move has shown genuine follow-through and momentum, which the RSI confirms by trending higher.
The $74k–$76k zone, which includes the former upper channel boundary and a key horizontal level, is now the most important area to hold during any retracement on the 4-hour chart. A successful retest of that zone followed by a rebound would be a textbook continuation setup and would add further conviction to the case that the $80k level, and potentially the $82k-$84k bearish order block, are the next meaningful targets in the coming weeks.

Sentiment Analysis
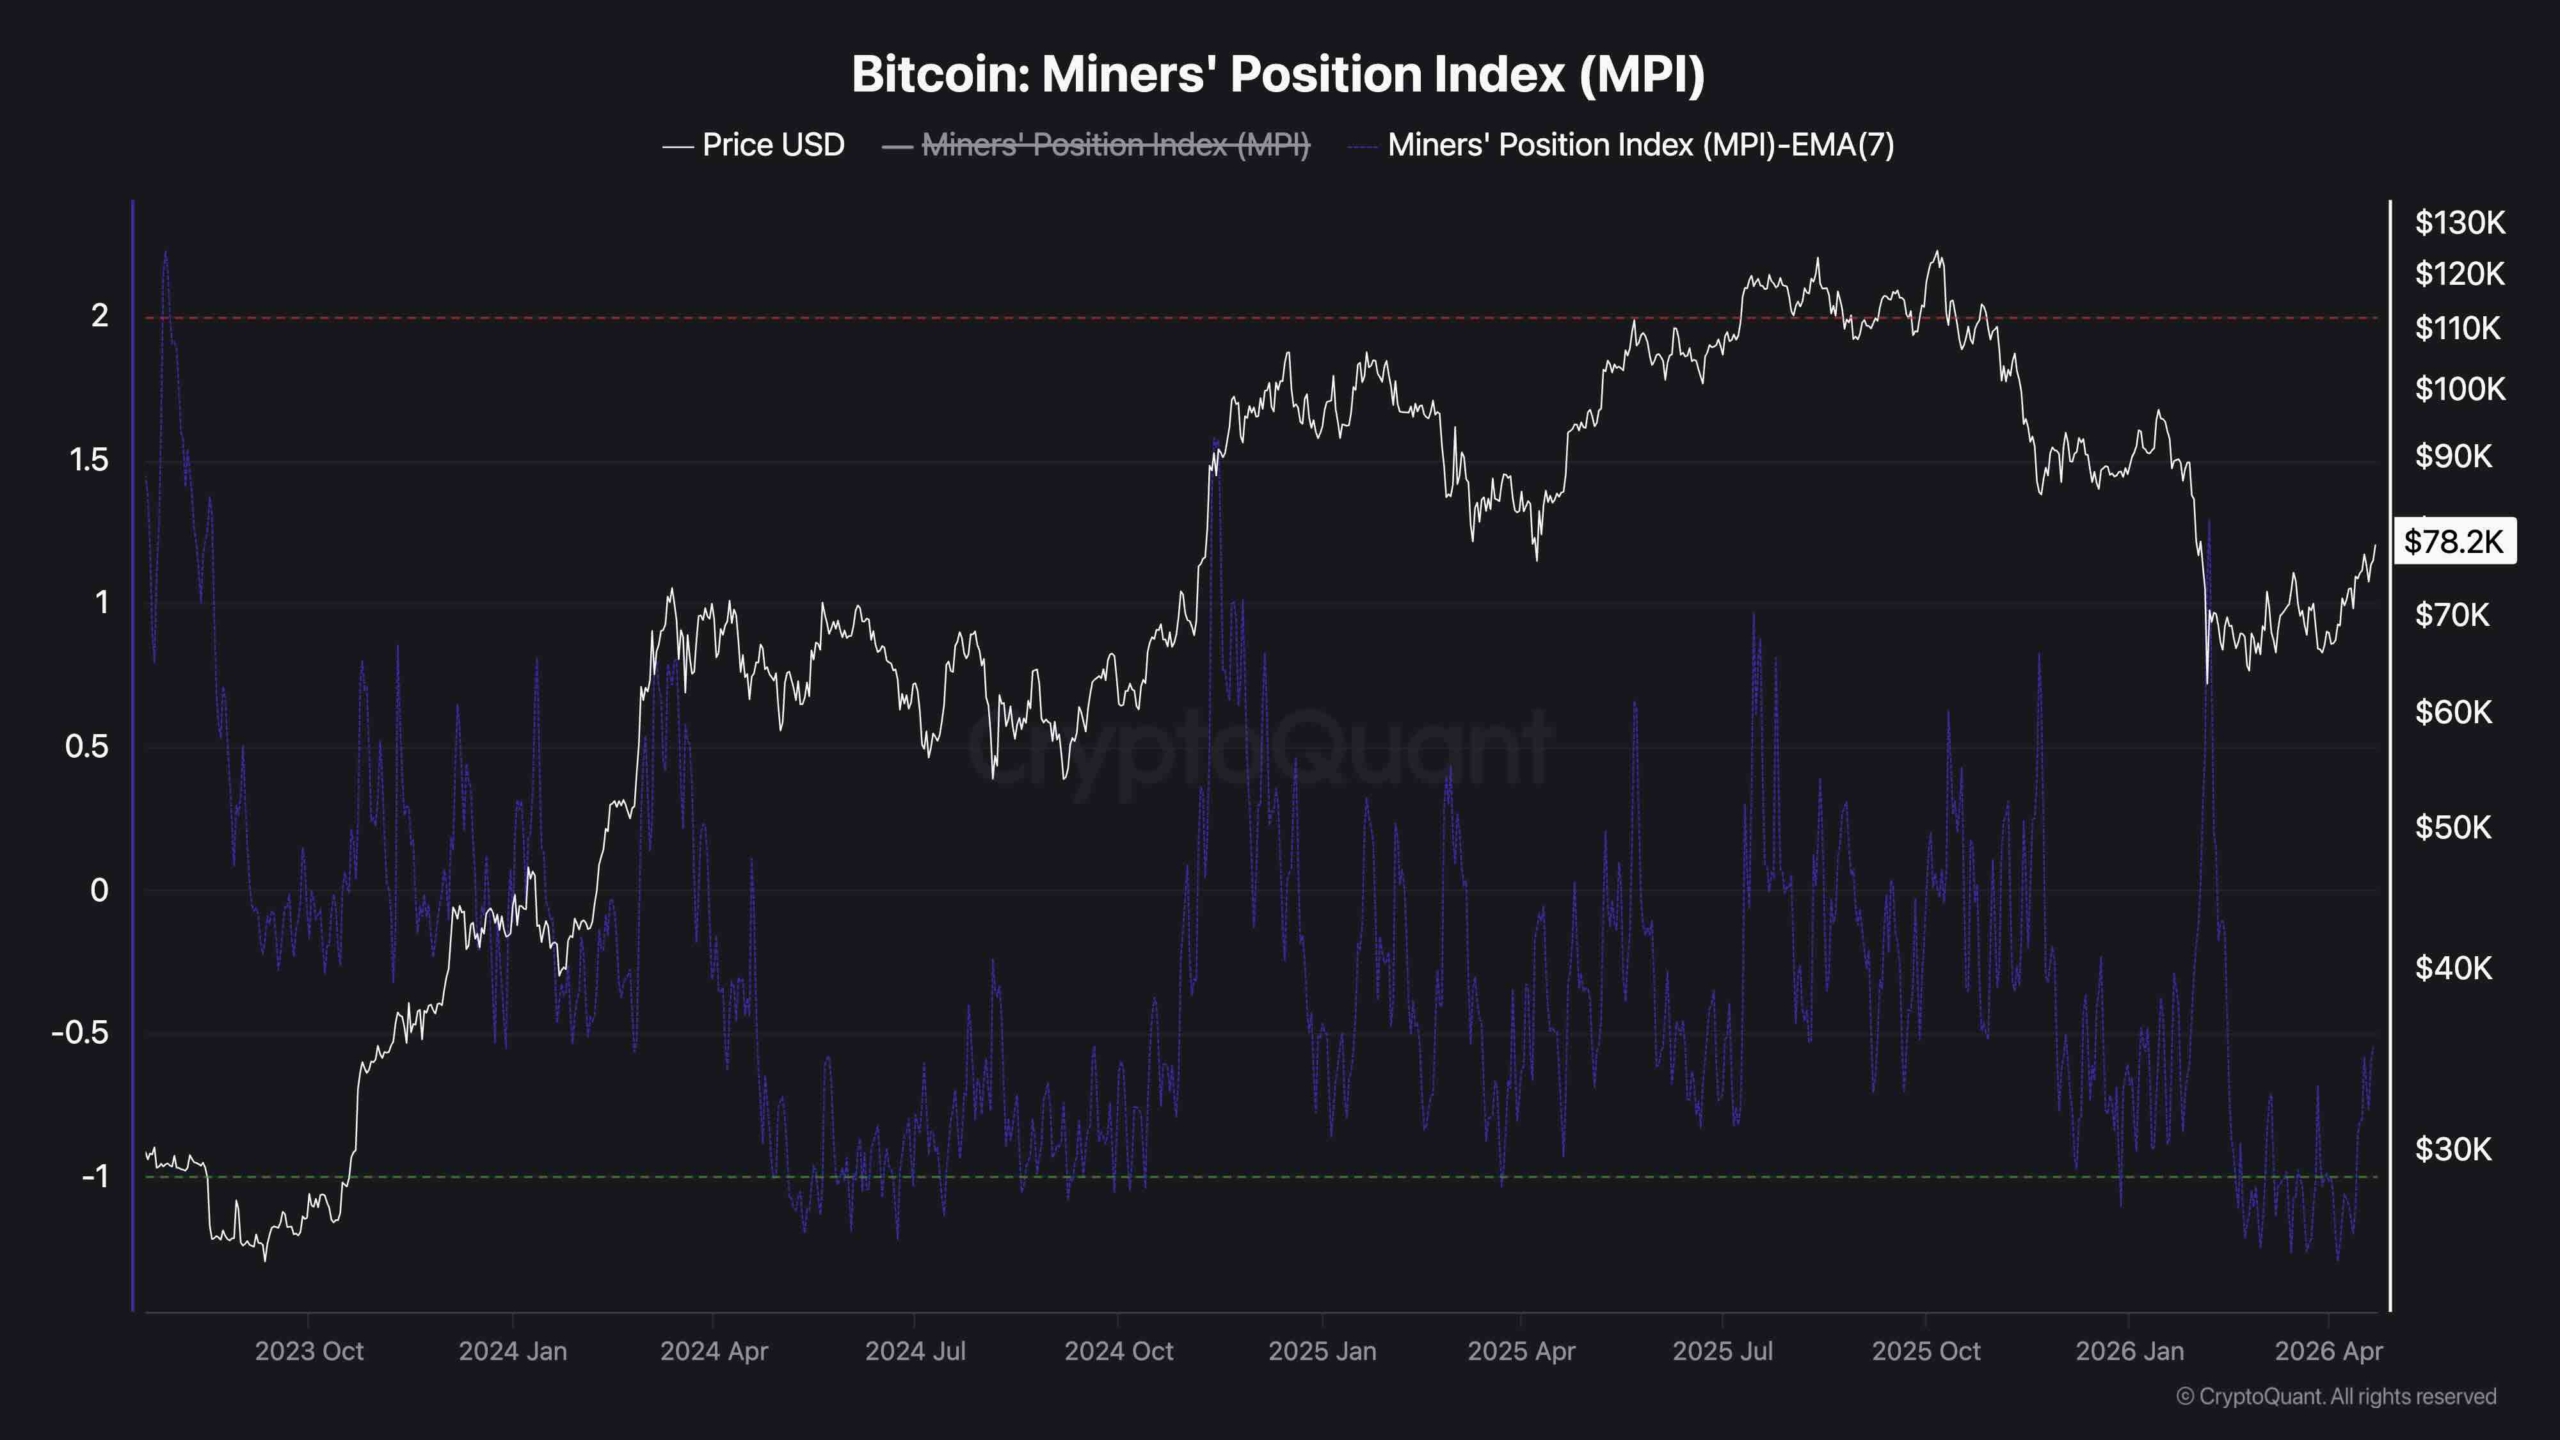
The Miners’ Position Index (MPI) is currently sitting below zero on the 7-day EMA. It has rebounded from the green zone that has historically marked periods of miner accumulation rather than distribution. Throughout the 2025 bull run, the MPI repeatedly spiked well above zero as miners sold aggressively into price strength. This behavior consistently preceded local tops. The current reading is the opposite, as miners are not rushing to sell into this rally.
The contrast with prior cycle behavior is meaningful. When the price was trading between $110k and $125k, the MPI was consistently elevated. Miners were offloading supply into demand. At $78k, with the index near its most conservative reading in over a year, miners appear to be holding their coins rather than taking profits. This reduces one of the most consistent sources of sell-side pressure in the Bitcoin market, and in a context where exchange reserves are also at multi-year lows, the supply picture heading into a potential push toward $80k looks considerably cleaner than it did at equivalent price levels during the previous rally.
Binance Free $600 (CryptoPotato Exclusive): Use this link to register a new account and receive $600 exclusive welcome offer on Binance (full details).
LIMITED OFFER for CryptoPotato readers at Bybit: Use this link to register and open a $500 FREE position on any coin!
Disclaimer: Information found on CryptoPotato is those of writers quoted. It does not represent the opinions of CryptoPotato on whether to buy, sell, or hold any investments. You are advised to conduct your own research before making any investment decisions. Use provided information at your own risk. See Disclaimer for more information.